Cees Bos
My gists about Observability

Incident reports are often static and lack the detail needed for deep analysis. What if you would use Observable Framework to create interactive, data-driven incident reports. By using customer impact data from DownDetector, you can build reproducible and interactive incident reports that clearly share your line of thinking.
Fri, 19 Dec 2025 11:55:58 +0100 Observable Framework
An Application Observability Code Challenge with
virtual threads. Spot the difference between system thread and virtual thread usage for the same application with some problems.Fri, 10 Oct 2025 22:20:11 +0200 Grafana Observability OpenTelemetry AOCC Puzzlers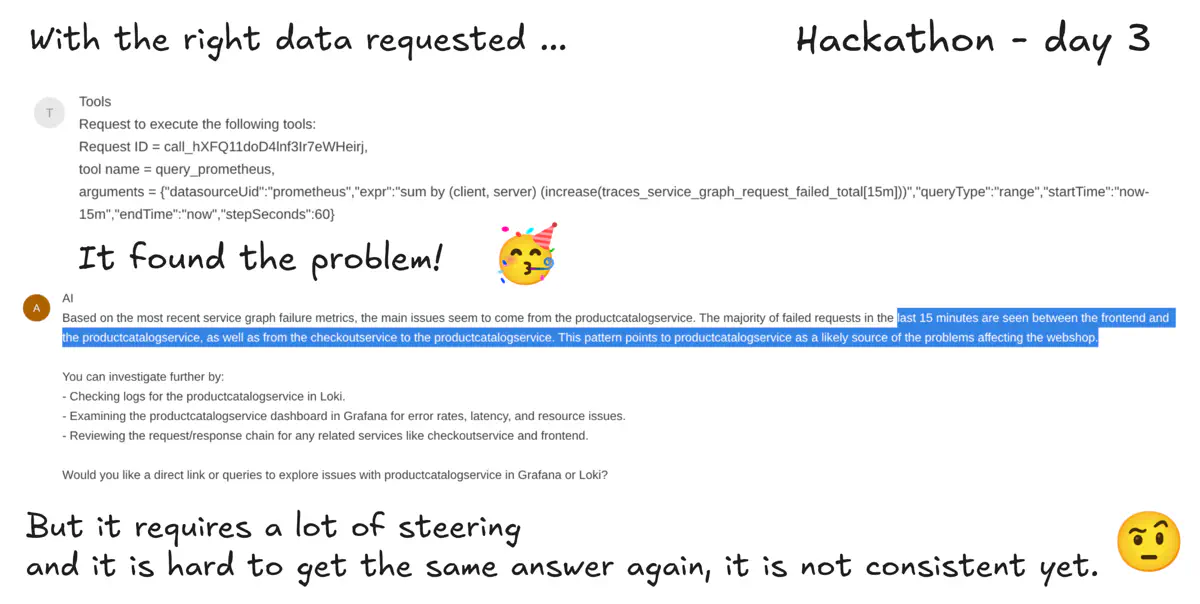
The third and final day of the hackathon. During this hackathon I learned a lot about Quarkus, LangChain4j, Grafana MCP and many other things. Read this blog to read the progress of the last day and my conclusions of the hackathon.
Tue, 24 Jun 2025 15:26:58 +0200 Grafana OpenTelemetry LLM LangChain4j Quarkus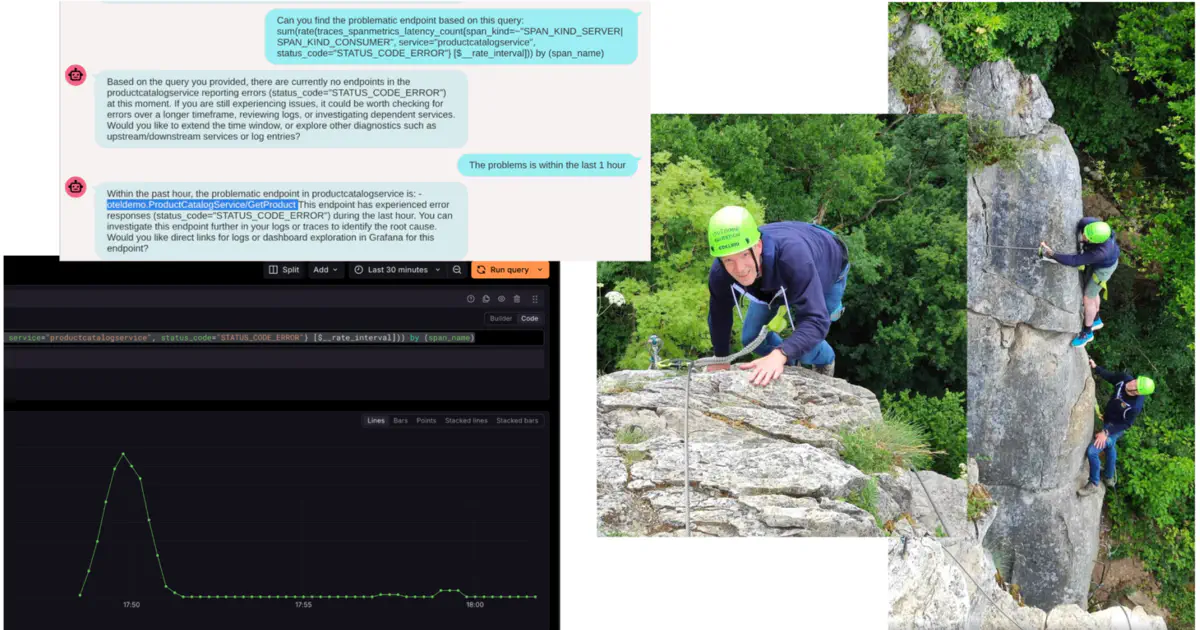
The second day of the hackathon was a mix of activities. Next to the hackathon, we had a climbing outdoor activity. In this blog post I will share the results of the hackathon on day 2 and some pictures of the climbing activity.
Mon, 23 Jun 2025 19:38:47 +0200 Grafana OpenTelemetry LLM LangChain4j Quarkus
Together with my colleagues of OpenValue Utrecht we are having a hackathon at a nice place in the south of Belgium. The goal of the hackathon is to build a monitoring buddy, a chatbot that can help you with your monitoring and observability questions. I will use Quarkus, LangChain4j, Tools and MCP in combination with Observability to build this chatbot. This blog post describes the progress on Day 1.
Sat, 21 Jun 2025 22:04:53 +0200 Grafana OpenTelemetry LLM LangChain4j Quarkus
The first of the Application Observability Code Challenges step by step revealed. The application has some unexpected behaviour. In this post I will explain step by step what you can learn from the metrics and how you can improve the observability of the application to finally find the real problem.
Fri, 02 May 2025 16:30:54 +0200 Grafana Observability OpenTelemetry AOCC Java
