Cees Bos
My gists about Observability

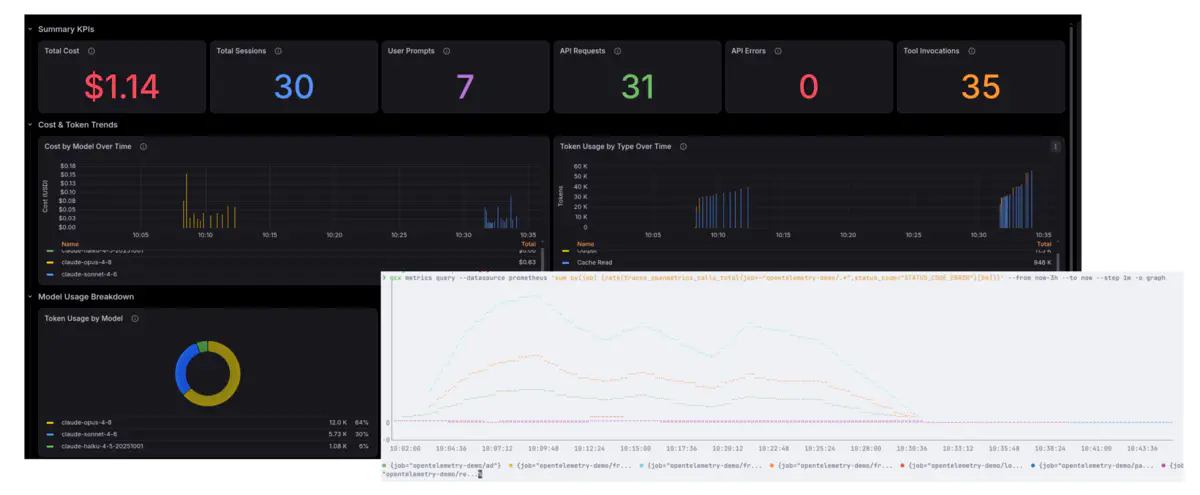
On day 3 of the hackathon, I compared Opus 4.8 and Sonnet 4.6 using the gcx tool and debug-with-grafana skill to diagnose a fault-injected failure in the OpenTelemetry demo. Both models pinpoint the root cause correctly, while Sonnet proves cheaper for straightforward issues. And an reflections after 3 days, on how skill files and the right context make AI-driven observability much more effective.
Tue, 30 Jun 2026 17:35:55 +0200 Grafana gcx Observability AI OpenTelemetry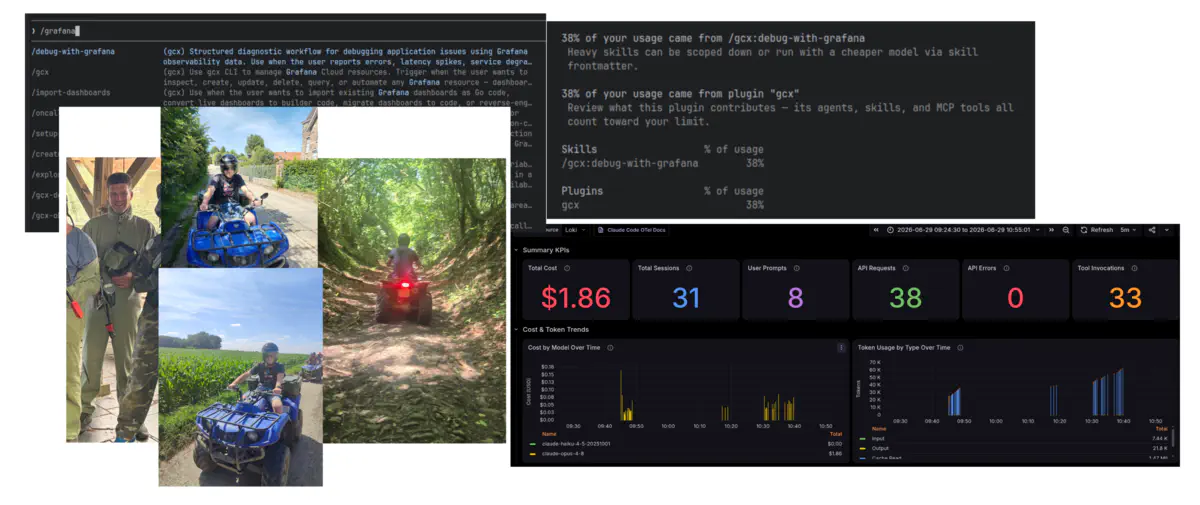
Day 2 of the hackathon. I used the Grafana gcx debug-with-grafana skill with Claude to find the root cause of failing and slow services from metrics, logs and traces, and monitoring Claude’s own token usage and cost with OpenTelemetry. And the team outing with Quad driving and paintball.
Mon, 29 Jun 2026 21:43:38 +0200 Grafana gcx Observability AI OpenTelemetry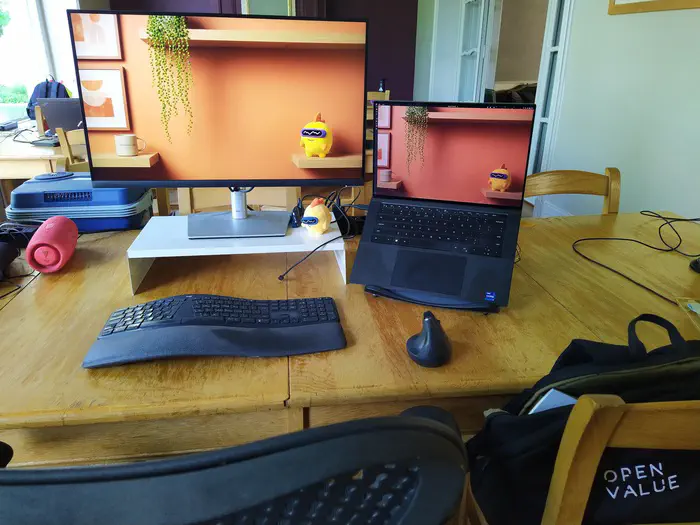
Day 1 of the OpenValue hackathon in Belgium. I explored AI tooling and got hands-on with gcx, Grafana’s Observability as Code CLI tool.
Sat, 27 Jun 2026 20:00:00 +0200 Grafana gcx Observability AI
An Application Observability Code Challenge with
virtual threads. Spot the difference between system thread and virtual thread usage for the same application with some problems.Fri, 10 Oct 2025 22:20:11 +0200 Grafana Observability OpenTelemetry AOCC Puzzlers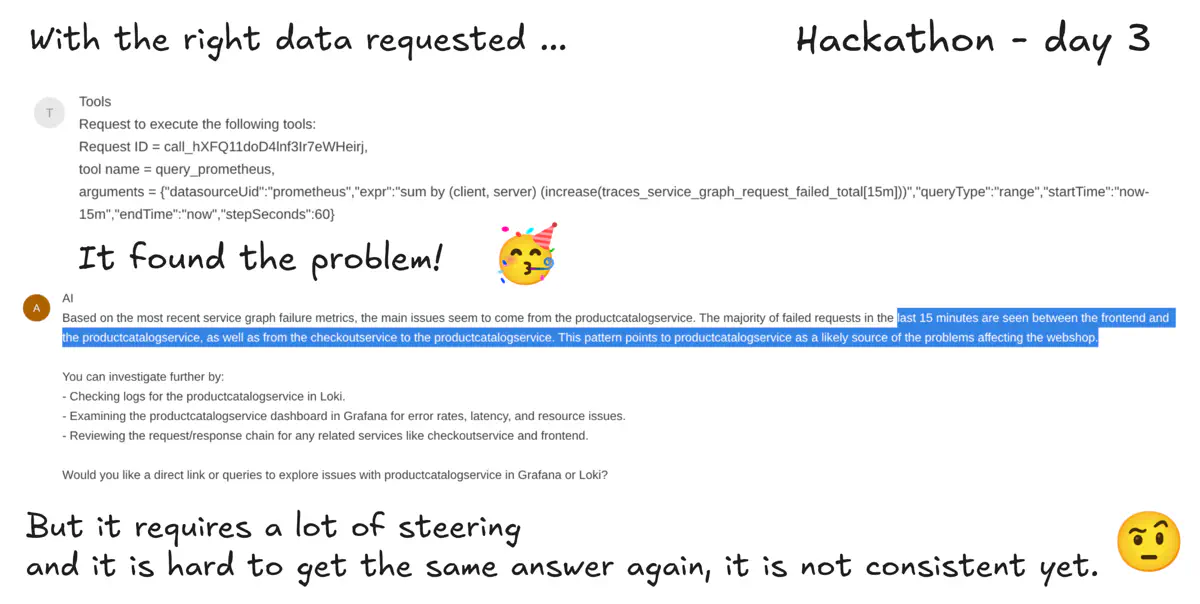
The third and final day of the hackathon. During this hackathon I learned a lot about Quarkus, LangChain4j, Grafana MCP and many other things. Read this blog to read the progress of the last day and my conclusions of the hackathon.
Tue, 24 Jun 2025 15:26:58 +0200 Grafana OpenTelemetry LLM LangChain4j Quarkus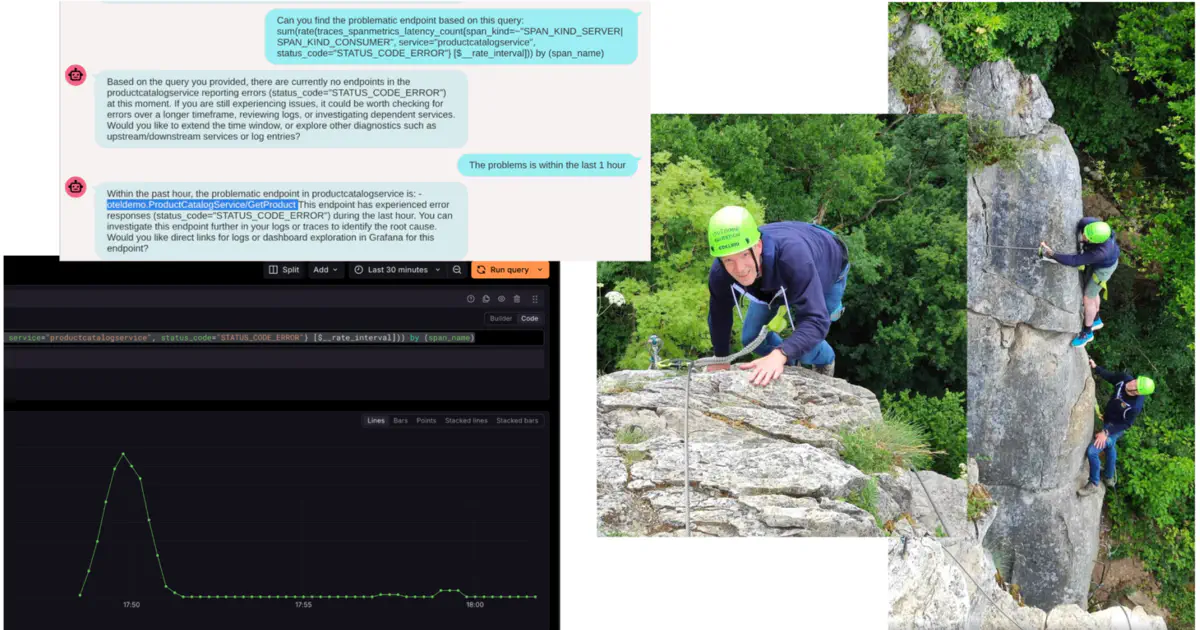
The second day of the hackathon was a mix of activities. Next to the hackathon, we had a climbing outdoor activity. In this blog post I will share the results of the hackathon on day 2 and some pictures of the climbing activity.
Mon, 23 Jun 2025 19:38:47 +0200 Grafana OpenTelemetry LLM LangChain4j Quarkus
