Blog Observability with logs and traces with Grafana Faro
If you use Hugo to create a blog or website, as I do, and you use GitHub Pages to host the blog, it’s hard to get observability signals in your usual observability stack.
I have been using Grafana, Loki, Tempo and Prometheus for a long time, so using this stack makes sense to me.
You can use Google Analytics with Hugo, but I don’t like third party cookies. If you search for Google Analytics and GDPR you will find quite a few articles about the concerns that exist on this topic.
But even apart from that, I like to see what I can get into the observability stack that I know.
No webserver, no metrics and logs?!
When you run your own webserver with Apache or Nginx, the servers will produce access logs files. You can parse these files with all kind of tools and feed them into a logs storage. The webserver will also generate metrics as well, which you can scrape with tools like Telegraf or OpenTelemetry Collector and push that to Prometheus, Mimir or InfluxDB. But there is more than just the server side.
What is Grafana Faro?
Grafana Faro is a highly configurable open source javascript agent that can easily be embedded in web applications to collect real user monitoring (RUM) data: performance metrics, logs, exceptions, events, and traces.
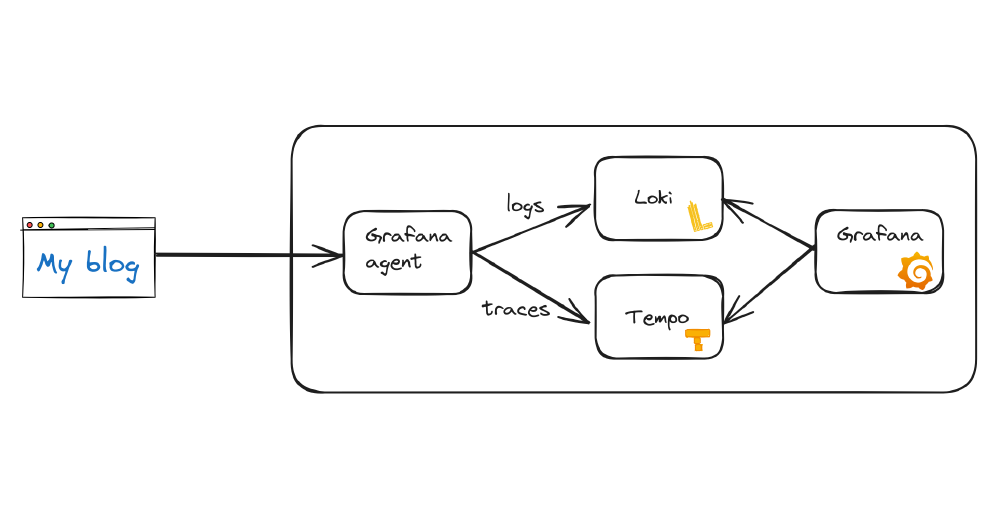
Faro consists mainly of a Web SDK and a collector. The collector runs on the server that receives all the data and splits the data into logs and traces. These logs and traces can be stored in Loki and Tempo.
Web SDK
Grafana Faro has a Web SDK that runs in the browser and you can embed it in your frontend application. It is able to collect all kinds of information:
- WebVitals about the loading and rendering of your page
- Console log messages
- Exceptions
- Traces based on OpenTelemetry-JS
As this can be embedded in a frontend application, I can use it in my Hugo site.
Local setup or Grafana Cloud
Grafana Faro can be used in a local setup like this:

Local setup with Grafana agent
The GitHub repository of Grafana Faro contains configuration examples for a local setup:
- docker-compose.yaml with Grafana agent, Grafana, Loki and Tempo and a demo app
- Agent receiver config documentation
- Tutorial with more details on the setup
Grafana Cloud
Grafana Cloud offers Frontend Observability, which is the Grafana Faro setup with predefined dashboards, but you are not limited to this. You can also create your own dashboards.
In Grafana Cloud you can add a frontend application and give it a name.
NOTE: Set the CORS headers correctly, otherwise you will not be able to push data to it.
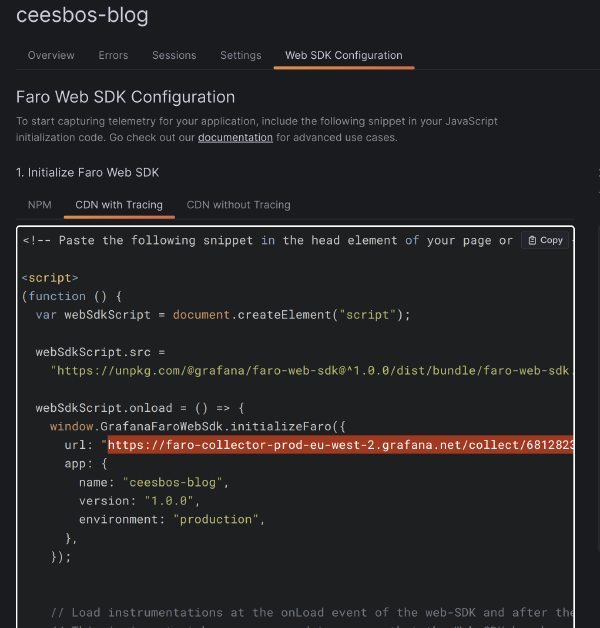
As last step you can see information like this:

The URL is the endpoint of the Grafana agent / collector at Grafana cloud. Similar as the agent with the local setup.
Integration with Hugo
Out of the box there is no integration with Hugo. But if it is not available, I can create my own.
This is what I did: https://github.com/cbos/hugo-faro-analytics
The module is basically the same JavaScript code that Grafana provides, but I made it configurable and available as a Hugo module. You can use it right away in your own Hugo environment if you like.
- Add the module as Git submodule
git submodule add https://github.com/cbos/hugo-faro-analytics.git themes/faro-analytics
- Enable the module in
config.tomlof Hugo (or YAML or JSON if you use that)
[module]
[[module.imports]]
    path = 'faro-analytics'
- Configure the module in the
config.tomlof Hugo
[params.faro_analytics]
    endpoint = "https://url to the agent with receiver config or Grafana Cloud"
    name = "Name of your site"
    version = "Your version"
- Almost everything is ready now, you only need to add a
partialto the header of each page.
This might need a change in the template you use. What needs to be added is this:
{{ partial "faro-analytics/assets/js" . }}
With the configurations done you can locally run
hugo serverand just open your own page. This will send the collector. When you run locally theenvironmentwill bedevelopment. In the build process to prepare for production it is common to set environment toproduction, that is automatically picked up by this module. So the data send from the production site is marked as production. That helps to make a distinction between local development and production.To each page the partial is added, it will automatically inject the observability code. If there are pages which you don’t want to get observability signals from, you can add this to a page:
faro_analytics:
  analyze: false
What about the metrics and traces?
How does the data look like which is send to the collector? And how do the traces look like? I will write a next post for that, it will be too much for this post otherwise.
