Grafana Scenes & Codespaces

With Grafana Scenes it is possible to create more than just dashboards. There are options to create dashboards that guide the user. Deep dives with drill down pages can help to analyse problems. And with a feature like time range comparison it is even possible to use a feature that is not available with normal dashboards.
But how do you start developing with Grafana Scenes? One trend is to develop remotely, rather than on your local machine. Let’s see how we can combine this.
In this blog post I will describe what I did using a GitHub repository and GitHub Codespaces.
Create a new Git repository and configure initial setup
I just created a new Git repository and after that I just choose to create an initial devcontainer.json:

This file is added as .devcontainer/devcontainer.json, the initial content is just this:
{
  "image": "mcr.microsoft.com/devcontainers/universal:2",
  "features": {
  }
}
Then I launched the Codespace environment. After it was loaded, I opened the terminal at the bottom and ran the first step of the instructions:
npx @grafana/create-plugin@latest
I followed the steps and the files were created in a new subfolder. Then I moved the files to the main directory.
Update devcontainer.json for development
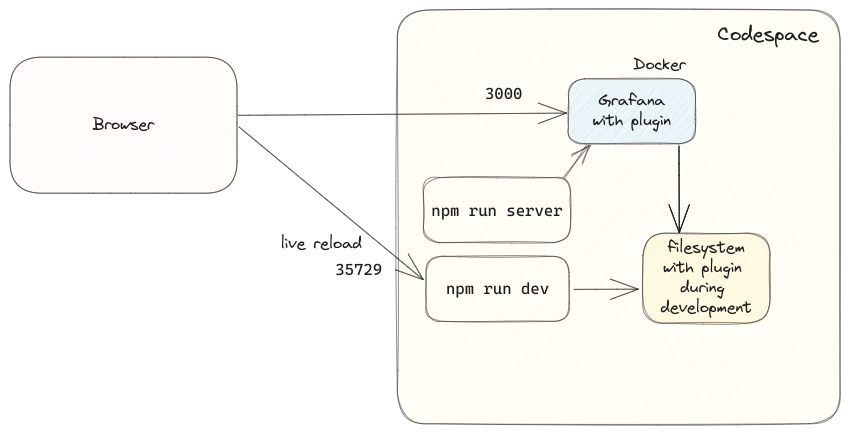
For development, there are two main commands to use:
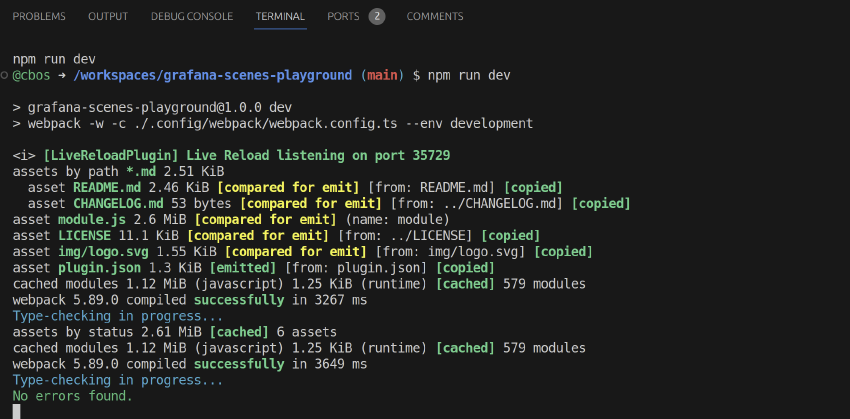
npm run devto continuously compile the modified codenpm run serverto start a Grafana docker container with the plugin loaded.
As part of the devcontainer.json file, it is possible to add a startup command that will be executed as soon as the Codespace environment is opened.

As part of the npm run dev command, a port is opened for the livereload plugin, which by default listens on port 35729.
And Grafana is started on port 3000. So these ports need to be opened.
The setup looks like this:

Exposing ports
To be able to reach Grafana and the livereload port, these ports need to be opened.
You can do this manually, but I have also added it to devcontainer.json as that makes it reproducible:
{
  "image": "mcr.microsoft.com/devcontainers/universal:2",
  "waitFor": "onCreateCommand",
  "updateContentCommand": "npm install",
  "postCreateCommand": "",
  "postAttachCommand": {
    "server": "npm run dev",
    "grafana": "npm run server"
  },
  "portsAttributes": {
    "35729": {
      "label": "Application",
      "onAutoForward": "silent"
    },
    "3000": {
      "label": "Grafana",
      "onAutoForward": "openPreview"
    }
  },
  "forwardPorts": [35729, 3000]
}
After the ports are configured, you can see that in Codespaces and you can open it is in the browser:

By default the Grafana Scenes setup assumes the livereload to be running on http://localhost:35729, but that is different now. In I changed that as well, more details in the commit
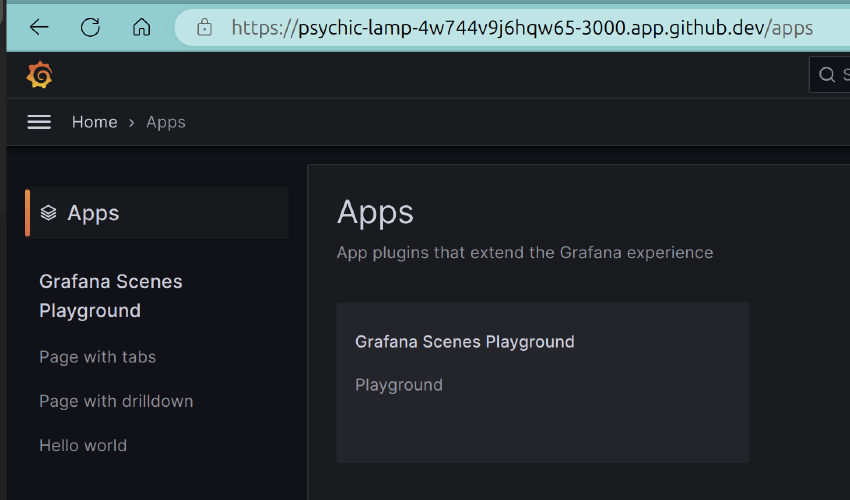
The final result looks like this:

