 Updates from Checkly Based on my previous post I have been in contact with Checkly about two parts that were not working as expected. I have some updates on these topics today. Sending traces from Checkly to Tempo In the previous post I mentioned that the traces in my Grafana environment showed root span not yet received. The root span was not available. This requires Checkly to send these spans to my environment as well.
Fri, 30 Aug 2024 20:56:40 +0100 Grafana Tempo Checkly OpenTelemetry Checkly This week I came across Checkly, a code-first synthetic monitoring solution that can do API checks and browser checks using PlayWright. It would have saved me a lot of time if this had been around 8 years ago. At that time I was working on a project where we were doing some external checks with a vendor like Checkly, but it was all manual configuration in a web interface. And internally we had a checker tool running that did all sorts of internal checks, both HTTP checks and database checks.
Wed, 21 Aug 2024 21:10:40 +0100 Grafana Tempo Checkly OpenTelemetry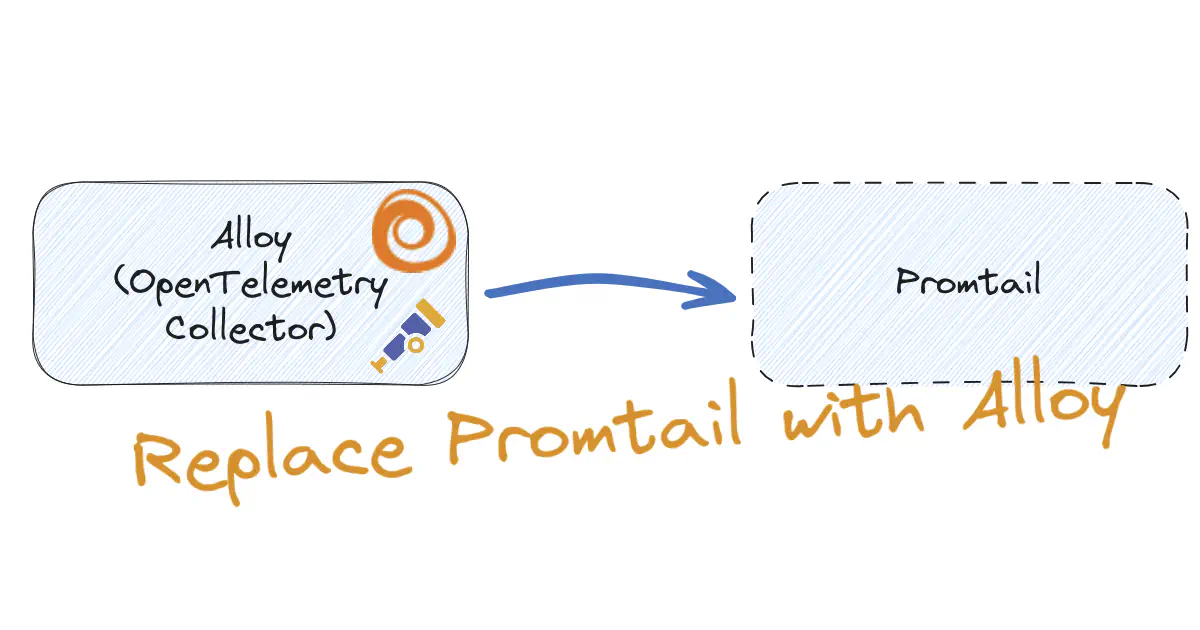
An announcement was made at GrafanaCON. Alloy is introduced in the family of Grafana tools. Alloy is an open source distribution of the OpenTelemetry Collector, but is will also replace Promtail.
In the Observability Toolkit I use both Promtail and OpenTelemetry Collector, so it makes sense to merge them.
In this blog post I will replace Promtail with Alloy. In another post I will see how replacing of OpenTelemetry Collector with Alloy will look like.Sat, 13 Apr 2024 13:45:40 +0100 Observability Toolkit Grafana Loki Promtail Alloy
Grafana Scenes can enhance your experience with Grafana dashboards by bringing observability data together and guiding users to the right data.
Combining metrics, traces and logs helps to understand the actual behavior of a system. That is the goal of observability. If a dashboard or an app created with scenes does not give the right insights, then still theexplorefeature of Grafana is available to dive into all data available searching for the unknown-unknown.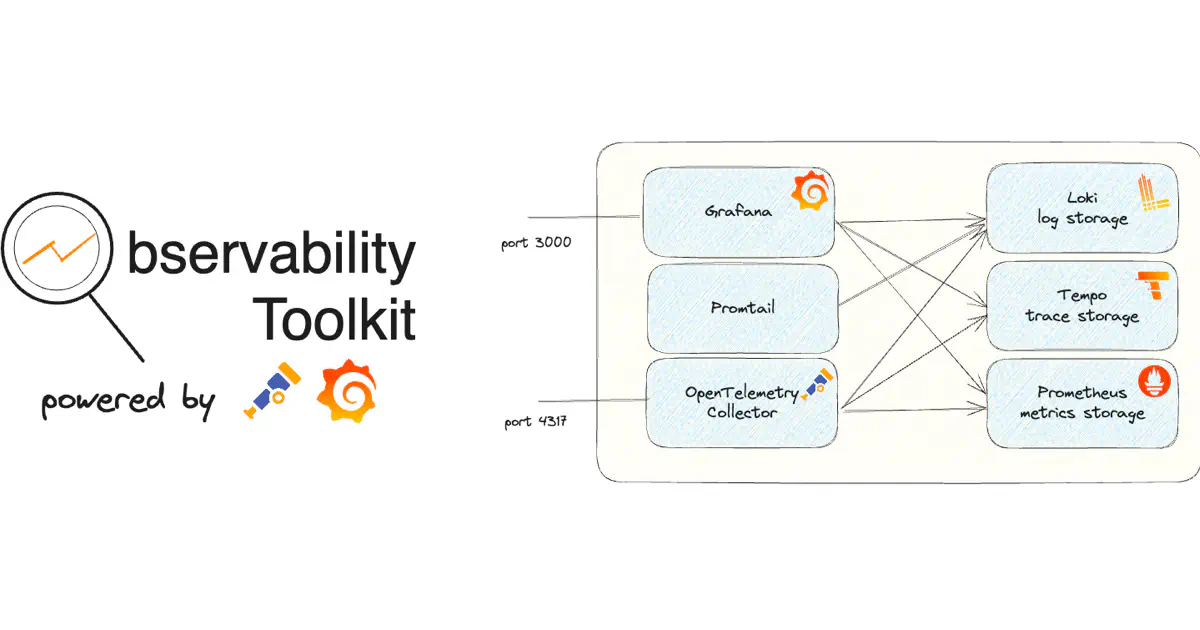
Deep understanding of the actual behavior of a system is key for me. I like to know all the details because it helps me to see the whole picture. I am visually oriented, so tools like Grafana really help me in these situations.
Observability is a topic that has come up in the last few years, but I have actually been doing this for years. But the good thing is that it is more standardized now. I really like that.
Fri, 26 Jan 2024 15:40:23 +0100 Observability Toolkit Grafana Loki Tempo PrometheusOne of the great things about OpenTelemetry is the standardisation of span attributes and resource attributes.
An example of this isdeployment.environment.Mon, 08 Jan 2024 20:10:00 +0100 OpenTelemetry Grafana Faro Tempo Hugo With Grafana Scenes it is possible to create more than just dashboards. There are options to create dashboards that guide the user. Deep dives with drill down pages can help to analyse problems. And with a feature like time range comparison it is even possible to use a feature that is not available with normal dashboards. But how do you start developing with Grafana Scenes? One trend is to develop remotely, rather than on your local machine.
Fri, 15 Dec 2023 21:45:00 +0100 Grafana Scenes Codespaces As shown in my previous post you can add Grafana Faro to get more information about users who visit a website, in my case my own blog. This is how that setup looks like. But what kind of data is available now? Data sent by the browser The libraries from the Web SDK collect technical details about the browser interaction. The goal is not to track users, but to collect all sorts of technical data to see if there are problems with the web pages and what the perceived performance is for the users.
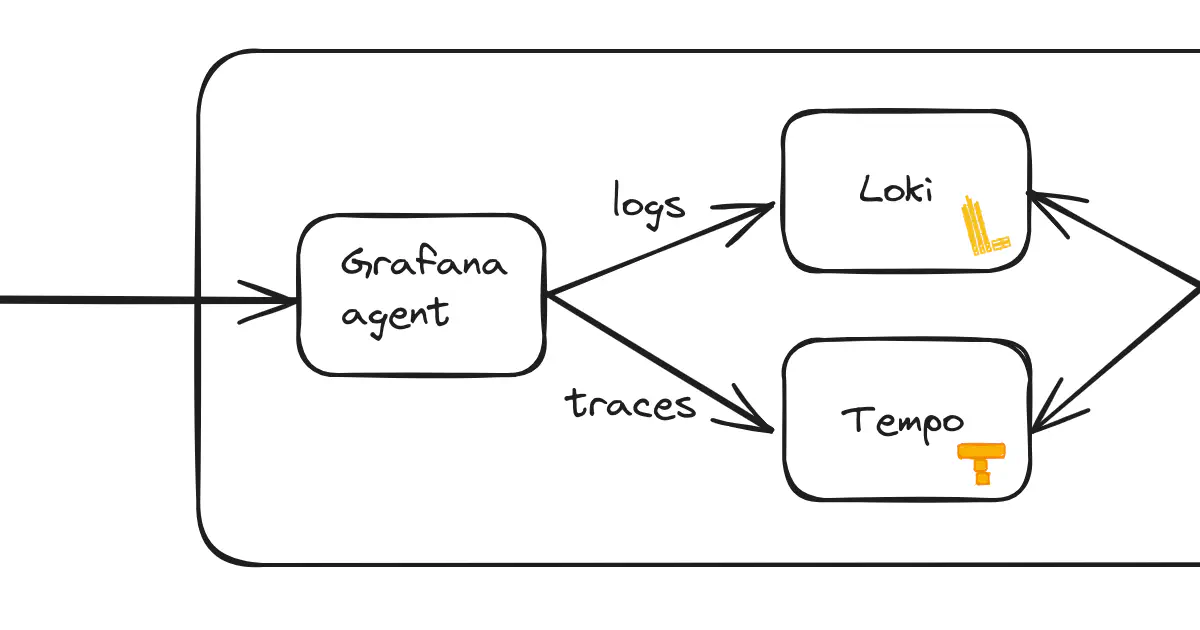
If you use Hugo to create a blog or website, as I do, and you use GitHub Pages to host the blog, it’s hard to get observability signals in your usual observability stack. I have been using Grafana, Loki, Tempo and Prometheus for a long time, so using this stack makes sense to me.
You can use Google Analytics with Hugo, but I don’t like third party cookies. If you search forGoogle AnalyticsandGDPRyou will find quite a few articles about the concerns that exist on this topic. But even apart from that, I like to see what I can get into the observability stack that I know.Fri, 24 Nov 2023 20:30:23 +0100 OpenTelemetry Grafana Faro Loki Tempo
I am passionate about Observability already for a long time. Monitoring tools have been helping me already for quite some years to get insights in the behavior of a service and especially a landscape of services. In 2016 I was working at a project where we were facing a number of problems and didn’t really have a clue what was going on in our application landscape. I suggested to work on more insights and we stared using Telegraf, InfluxDB, Prometheus and Grafana. Grafana 3.1 was the first release we used. The more metrics we put into InfluxDB the more insight we gained. We were able to move from reactive to proactive. The load on the systems was doubling every year, so we knew we had to make sure we were prepared. And because of the insights we were able to invest in the next bottleneck so we could serve customers with the right quality.
Sat, 18 Nov 2023 20:13:23 +0100
propulsed by
hugo
and
hugo-theme-gists with

